FieldAgent - Create and Share a Report
Create a Report in FieldAgent on Desktop
FieldAgent Desktop has two options for creating reports; Basic and Detailed.
Basic Report
To generate a basic report:
Open FieldAgent on Desktop.
Navigate to the field you would like to generate a report on.
Set up the screen with the content you would like to display on the report.
Select the PDF icon at the top of the screen.
Select basic report.
Add notes.
Click Done.
Detailed Report
To generate a more detailed report, select Detailed Field Report when given the option. With this option selected you’ll be able to use the camera icon at the top of the screen or within a photo viewer to capture the images you’d like to include in the report.
When you’ve captured all the images you’d like to include in the report, select the report icon at the top of the screen.
A tool will open which allows you to customize the report.
Make any changes you’d like and then select Build and Done.
Sharing a Report
With the .PDF report open on your computer, select Save As.
Name and save the report in a location you can navigate to later.
The report can then be shared via any desired communication method (for example, email).
Create a Web Report
From the Field menu:
|
1. Select a field, as shown in the following figure.
2. Select a map layer, as shown in the following figure
3. Select an item from the Map Layer area, as shown in the following figure. Click back arrow to return to Field Details.
4. Click Create Report, as shown in the following figure.
5. To add Weather data to your report, select your crop season and then choose your date range, as shown in the following figure. Changing the date range will alter the weather data displayed in your report.

This step is required to add weather data to your report.
Weather Data Includes:
- Days elapsed
- Accumulated Growing Degree Days
- Total rainfall (Inches)
- Total rainfall average (Inches)
- Total Evapotranspiration (Inches)
6. Select Paper Size, if appliable.
7. To upload a logo to brand the report, click the Logo toggle switch, as shown in the following figure.
8. Drag and drop a logo graphics file, or click Upload File to browse to the logo location.
9. Rename the logo something familiar to easily identify for future reports.
10. Click Save Logo.
11. Click the Contact Details toggle switch to enter details to display on the report.
12. Enter the contact details.
13. Name the Contact Details Name something familiar to easily identify for future reports.
14. Click Save Contact.
15. The web report displays showing default names. You can rename the report to something more appropriate to this field by clicking the edit button, as shown in the figure below. The image name can be renamed also by clicking the edit button. You can so add notes to the report by clicking the Add Note button.
16. The report is ready to download. Click Download Report to save to your computer.
17. The report can be sent to others through your email application.
Create Stand Report On The Web
1. Select a field.
2. Click Map Layers.
3. Select Spot Scout map.
If a Spot Scout population map is selected, the report title is changed to Stand Count and planting rate and population is added
4. Click the back arrow to return to the Field Details menu.
5. Click Create Report. Add logo and contact information, if applicable.
6. The Stand Count Report displays.
Note that the Spot Scout Map changes display between FieldAgent Web and the web report. This is to increase the readability of the data. The next section covers why and how FieldAgent Web does this.
Spot Clustering in Web Reports
When viewing Spot Scout data at various zoom levels, the disks may overlap one another, obscuring the data as in the below example.
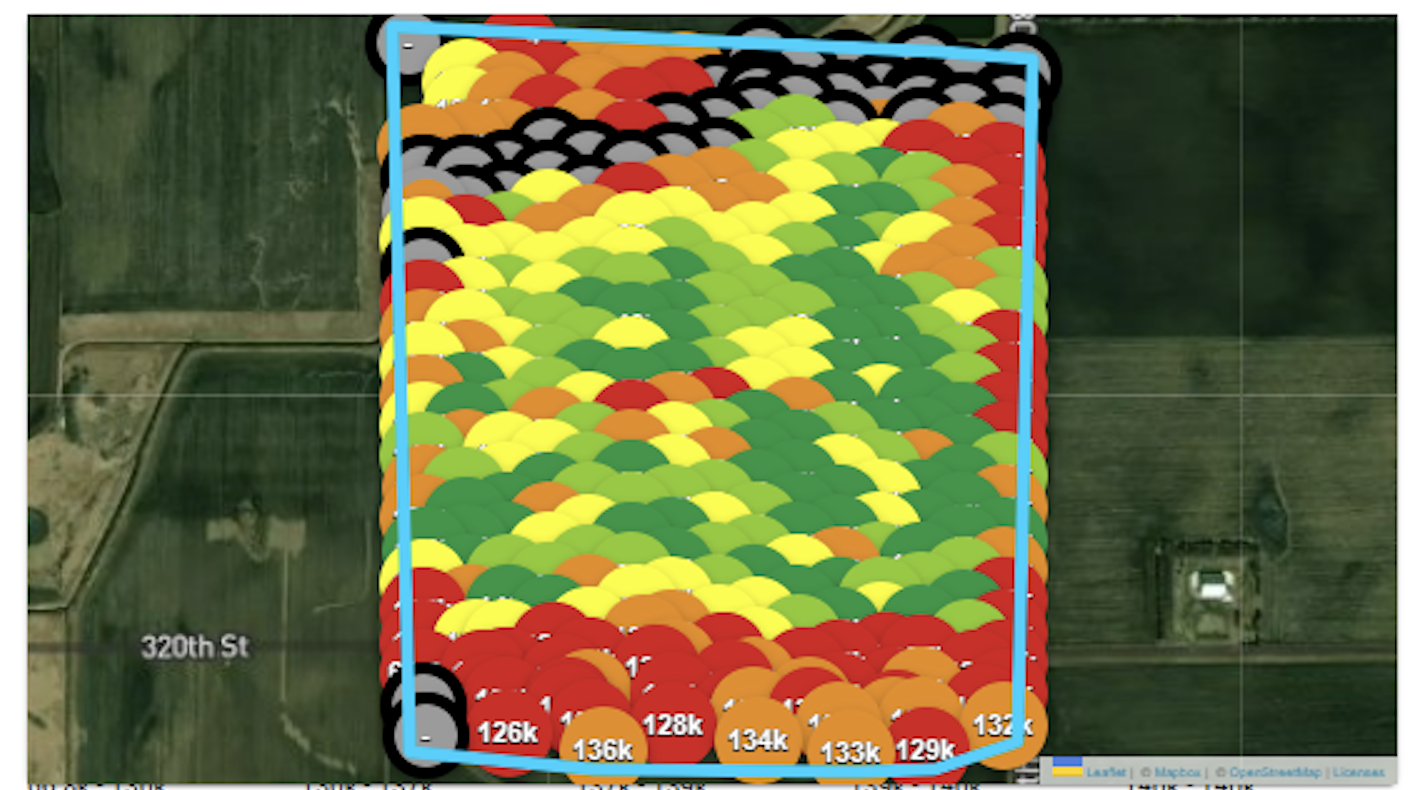
Within FieldAgent Web, it is possible to modify the zoom level to see the individual data points. When creating a report, in order to represent the captured data clearly across the entire field, a clustering algorithm is applied to remove overlapping data points. The clustering algorithm chooses to display the disks that are nearest to the center of the clustered region. In this way, the displayed data is both clearly visible and representative of the data captured across the entire field.
When the clustering algorithm has been applied to a map on a report, the message “Data displayed has been aggregated and optimized for visibility” will appear in the upper left corner of the image attached to the report, as shown below.
Related Articles
FieldAgent - Share a Field
Fields can be shared with any email address. If the email is associated with a FieldAgent account, the share will last indefinitely. If the email is not associated with a FieldAgent account, the share will last for 365 Days. A video guide can be ...FieldAgent Desktop - User Guide
Field Agent Desktop User Guide English Engineered in Minneapolis, MN, USA 14 April 2022 Doc #67002 Rev E Copyright © 2022. All rights reserved. Trademark Notice FieldAgent, AgVault, and Incident Light Sensor are registered trademarks of Sentera. ...FieldAgent Web - User Guide
Click below to download the FieldAgent Web User GuideFieldAgent - Mobile Stand Count
Overview The Mobile Stand Count feature for FieldAgent Mobile (iOS app) is intended for quickly processing shareable Stand Count results from the field’s edge. The video below shows it populating in real time: A map result will be shareable ...FieldAgent
Training Plan > Mobile User Guide Web User Guide Desktop User Guide Account Setup & Management Account Settings Enabling Location Services Ensuring Browser Compatibility Correcting the City and/or Country Field Management Draw, Edit, and Delete a ...